Return on Investment, Internal Rate of Return, Cash-on-Cash Return and Capitalization Rate are terms used frequently when talking about Real Estate Metrics. But if you just began investing, you may not know exactly what these metrics mean or how to properly calculate them. In this article, we’ll go over a few of the metrics that I think are most important and most helpful to single-family home investors. This week, one of our in-house agents with CB Properties, Jack Inman, has put together a good article going over these essential metrics that all real estate investors should understand.
Cap Rate = NOI / Value
One of the most common metrics is the Overall Capitalization Rate, or ‘Cap Rate’ for short. This figure will be provided in most listings, and it’s an excellent way to compare one property to another. It’s calculated by taking the Net Operating Income and dividing it by the Purchase Price of the investment.
Equity Capitalization Rate = BTCF / Equity investment
To figure out your return on leveraged real estate, you can use a metric called the Equity Capitalization Rate. This figure is also known as the cash-on-cash return, or sometimes the return on equity/investment. It is useful when determining the return on equity that the investor will receive in year one of the holding period. It is calculated by taking the Before Tax Cash Flow, BTCF, and dividing it by the Equity Investment.
BTCF is calculated by subtracting the annual debt service from the NOI. So, Let’s say you use a conventional loan to buy this $100,000 property with a cap rate of 7.5%. Your loan will be $80,000 and your down payment, or ‘equity,’ would be $20,000. If you can borrow money at 5% then your annual debt service would be around $5,148 based on a 30-year amortization. Take the NOI, 7,500, and subtract the annual debt service of $5,148, and you’re left with $2,352. This is an 11.76% return for the equity investor in year one. By using positive leverage you’ve increased your returns by over 50%, from 7.5% to 11.76%.
Net Operating Income
This is the income left over after subtracting every expense, except for the debt service, from the gross potential income. The Cap Rate shows the investment potential of the property in a way that makes it very easy to compare among other investment properties; all else being equal, the higher the cap rate, the better the returns. Often the Cap Rate will be somewhere between 6%-10%. This means that if you bought a $100,000 with a cap rate of 7.5% then that property should produce a profit, or cash-flow, of around $7,500 per year.Does this mean that I’ll make an 7.5% return on my money if I buy a property with a 7.5 cap?
Not necessarily. If you buy the property with cash, then in year one, you’ll likely make a return close to the cap rate. However, most investors choose to use a loan when buying a rental property, and the leverage created by debt will change the investor’s return. If you can borrow money at an effective interest rate that is less than the cap rate, then you can utilize positive leverage, and your returns will increase. For example, if the property you are purchasing has a cap rate of 7.5% and you can borrow money at an effective interest rate of 5%, then the 2.5% spread is the additional profit created by positive leverage.
IRR: Internal Rate of Return
What if you want to find out the Compounded Rate of Return on one of your investments? That would be your IRR or Internal Rate of Return. One of my personal favorite metrics of return is the Internal Rate of Return. This formula is rather complex, but it provides a very in-depth analysis that includes the returns made from cash flow, appreciation, and payments on the principal of the loan. It is a form of financial discounting, and the result is a return that is essentially the compounded rate of return for the entire holding period of the investment. The calculation requires an estimate of how long you’ll hold the property, and at what price the property will sell for at the end of the holding period. I’d recommend using excel or one of the many free IRR calculators online to do the actual math. You’ll just need to determine the series of cash flows for the length of holding, and then input them into the IRR calculator. Below is a spreadsheet made for our example property based on a 10-year holding period.
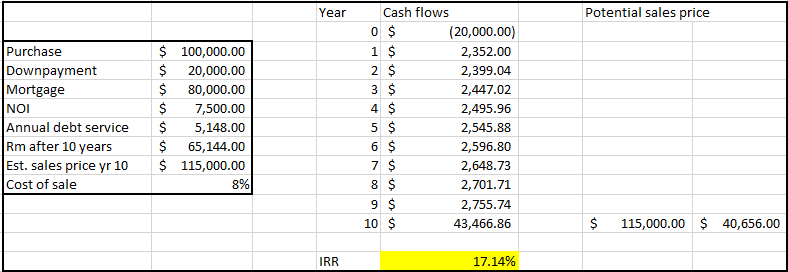
The series of cash flows needed to accurately estimate the IRR are the:
1. Down Payment – in our example this was $-20,000 as shown in ‘year 0’
2. The Rental Cash Flow – first year was $2,352 and it escalated at 2% per year (rental rates usually follow the rate of inflation)
3. The Before Tax Equity Reversion – this was $40,656 in our example. This is calculated by taking the estimated sales price in year 10 ($115,000) and subtracting the cost of sale (Realtor and closing attorney fees ~ 8%) and subtracting the remaining balance on the mortgage ($65,144).
The IRR, or compounded rate of return, ended up being just over 17%. Armed with the ability to understand and calculate the cap rate, cash-on-cash return, and the IRR, you’ll be able to make prudent real estate investing decisions.